


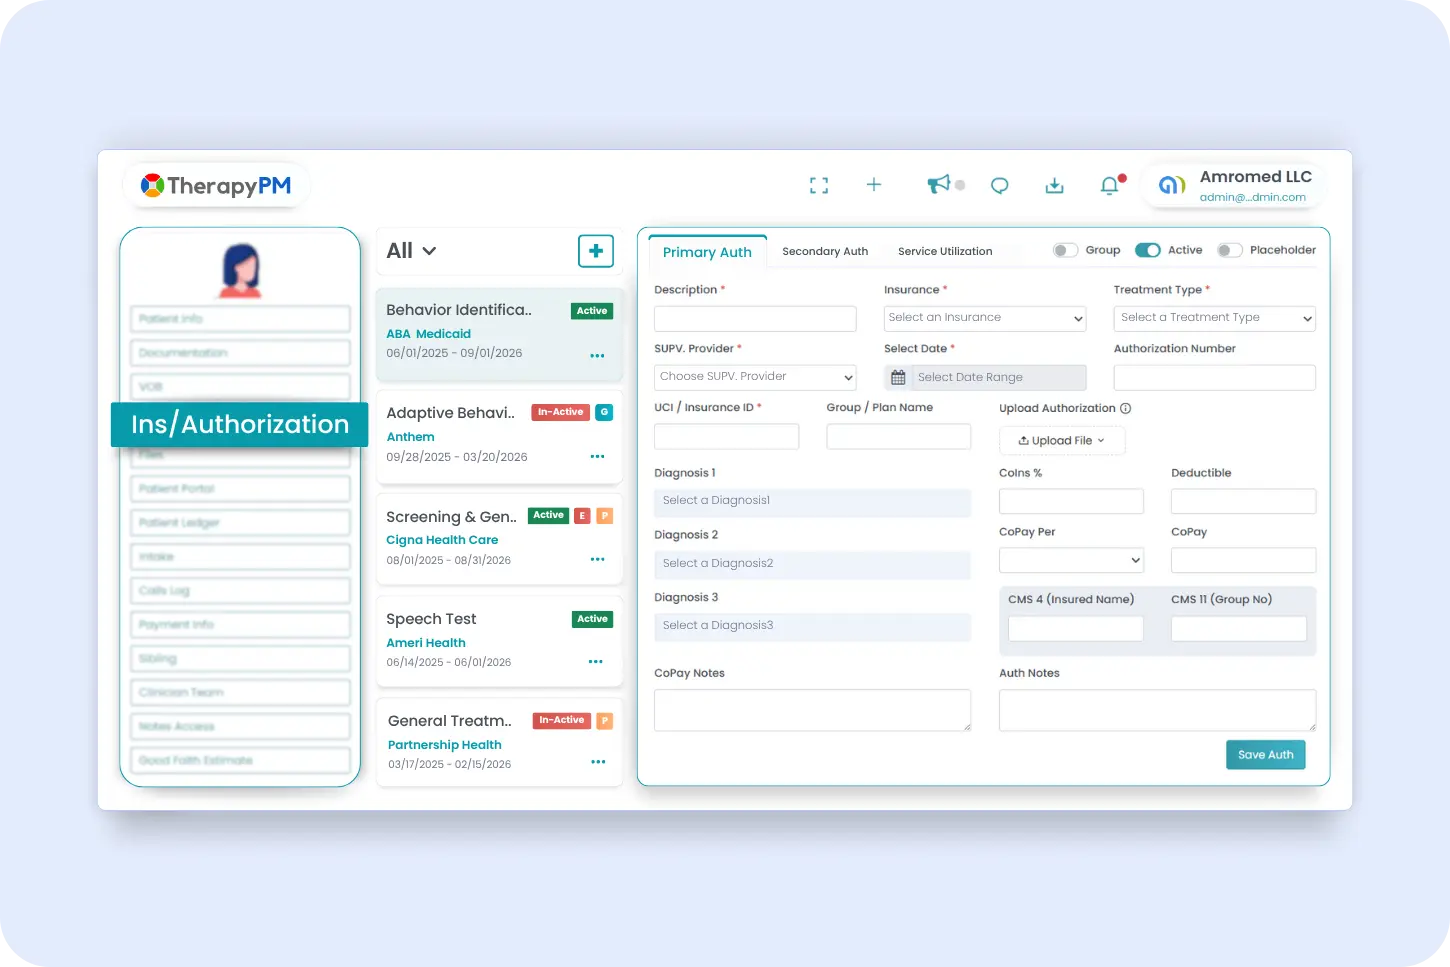
Avoid Care Delays with Timely Authorizations
Add, edit, clone, and manage primary and secondary authorizations. Track service utilizations, auth statuses, and expiration dates.
Learn more 🡺
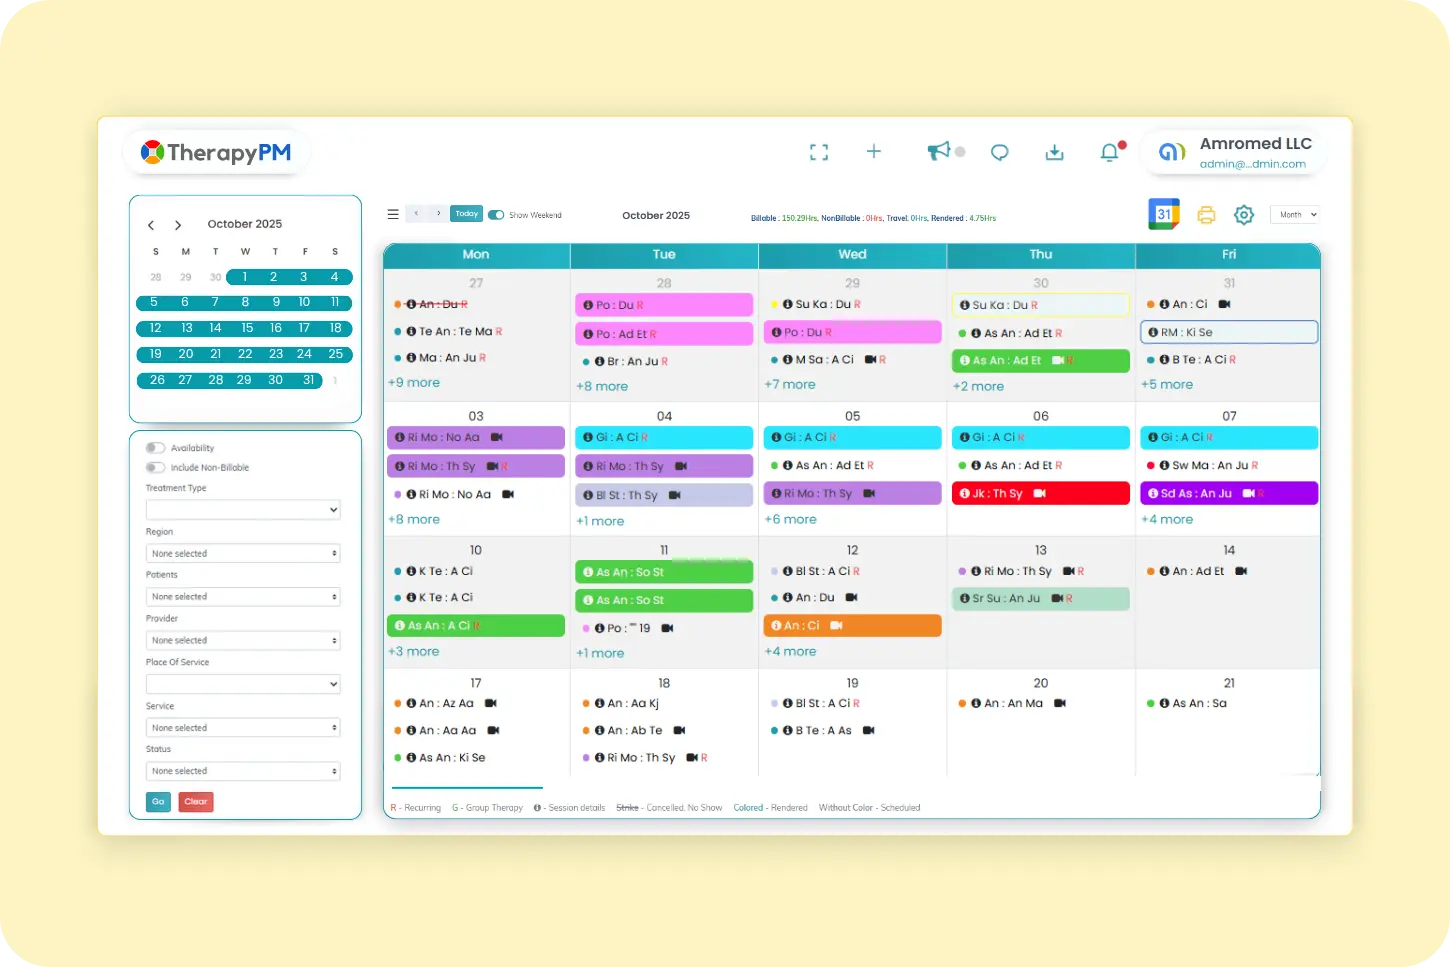
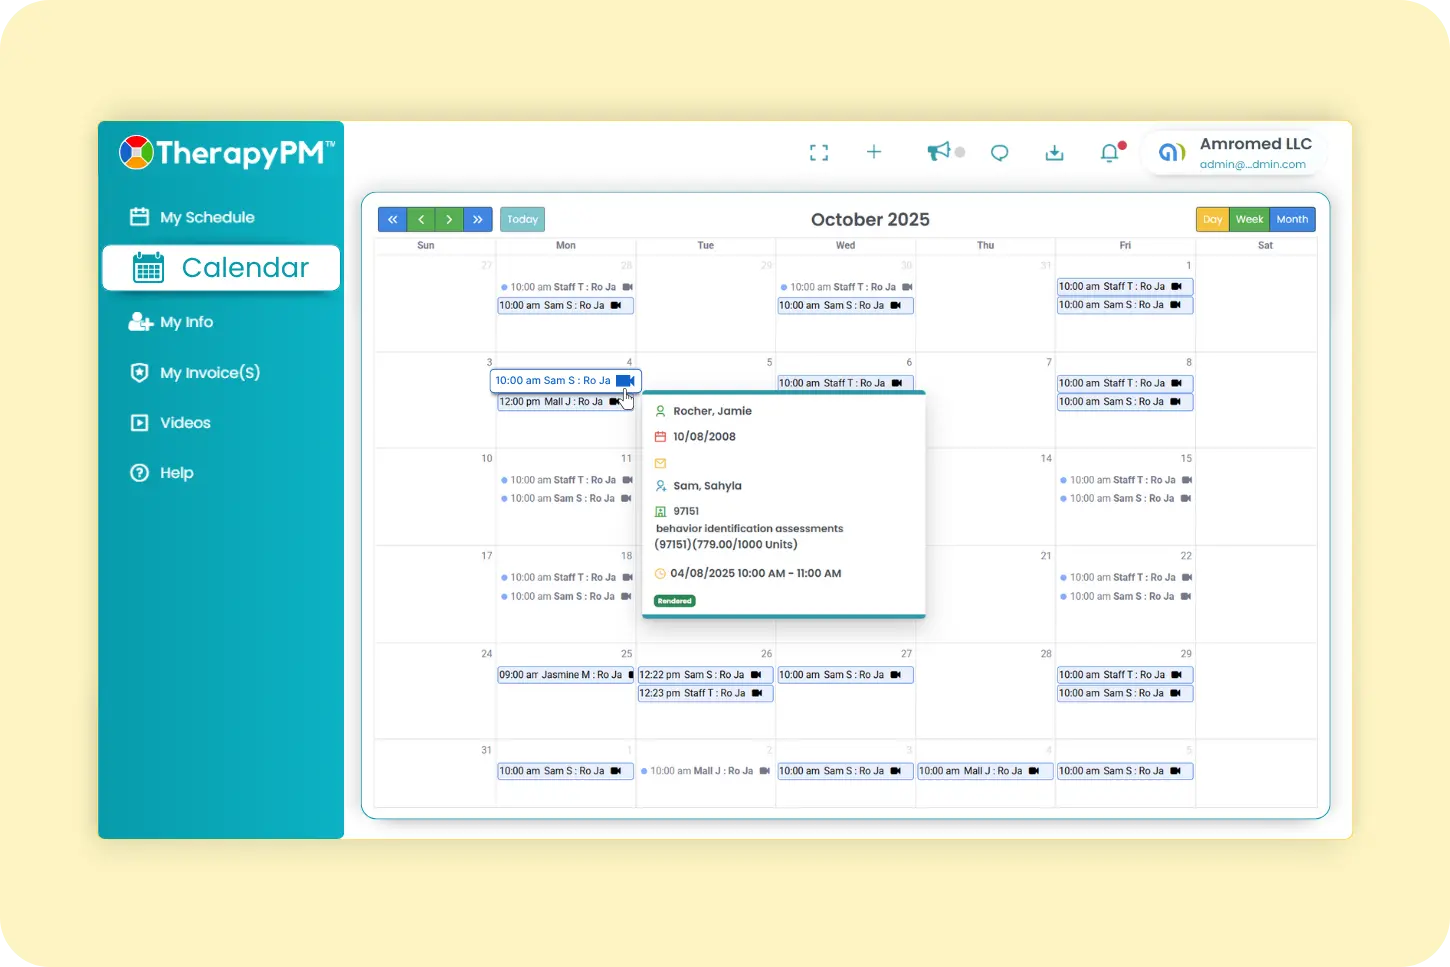
Appointment Management Simplified in Seconds
Schedule, view, and manage therapy appointments. Send automated SMS/Email reminders, sync sessions, and block off time.
Learn more 🡺
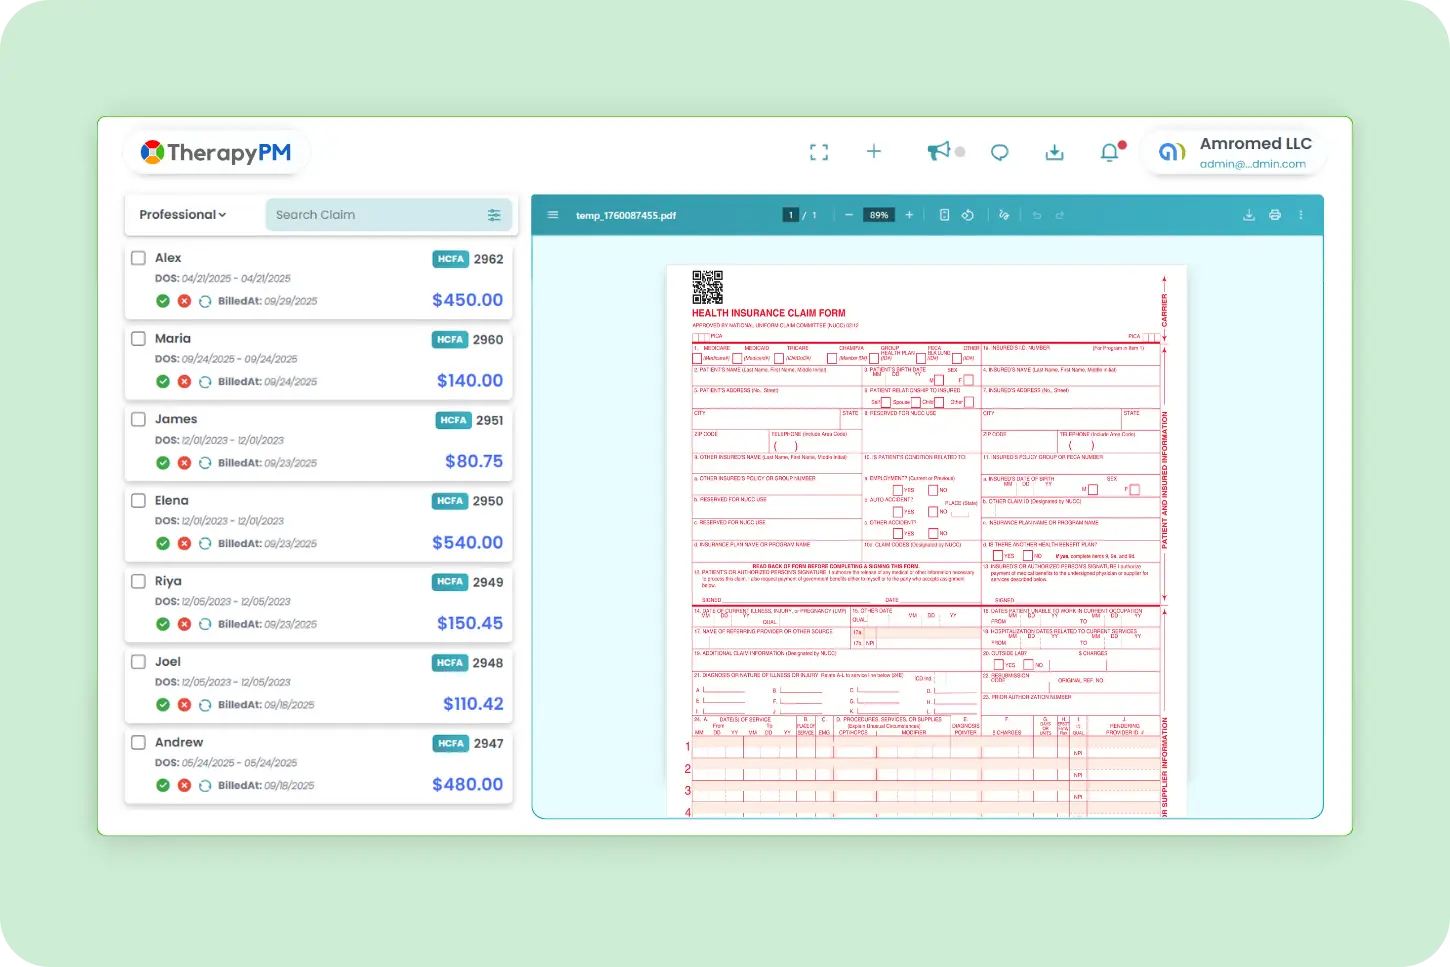
Reduce Claim Denials & Get Paid Faster
Cross-check claims before submission with built-in error detection. Verify patient coverage and benefits instantly, and manage the revenue cycle.
Learn more 🡺
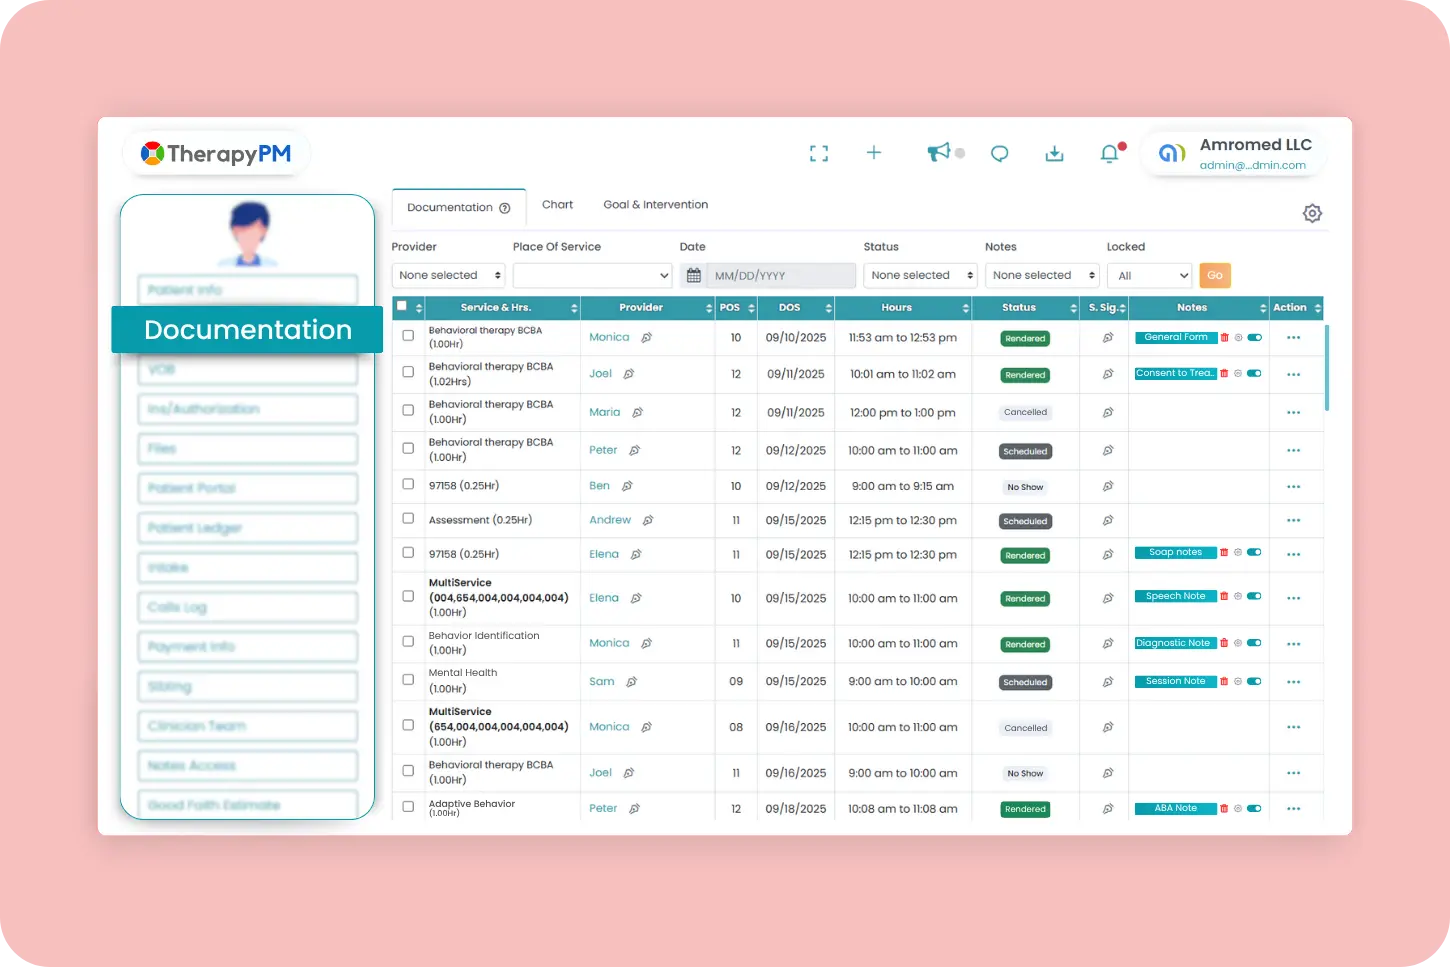
Document Sessions Instantly Without Stress
Customize SOAP/BIRP or treatment plans for specialty types. Write notes in real-time, view and manage them, and add signatures.
Learn more 🡺
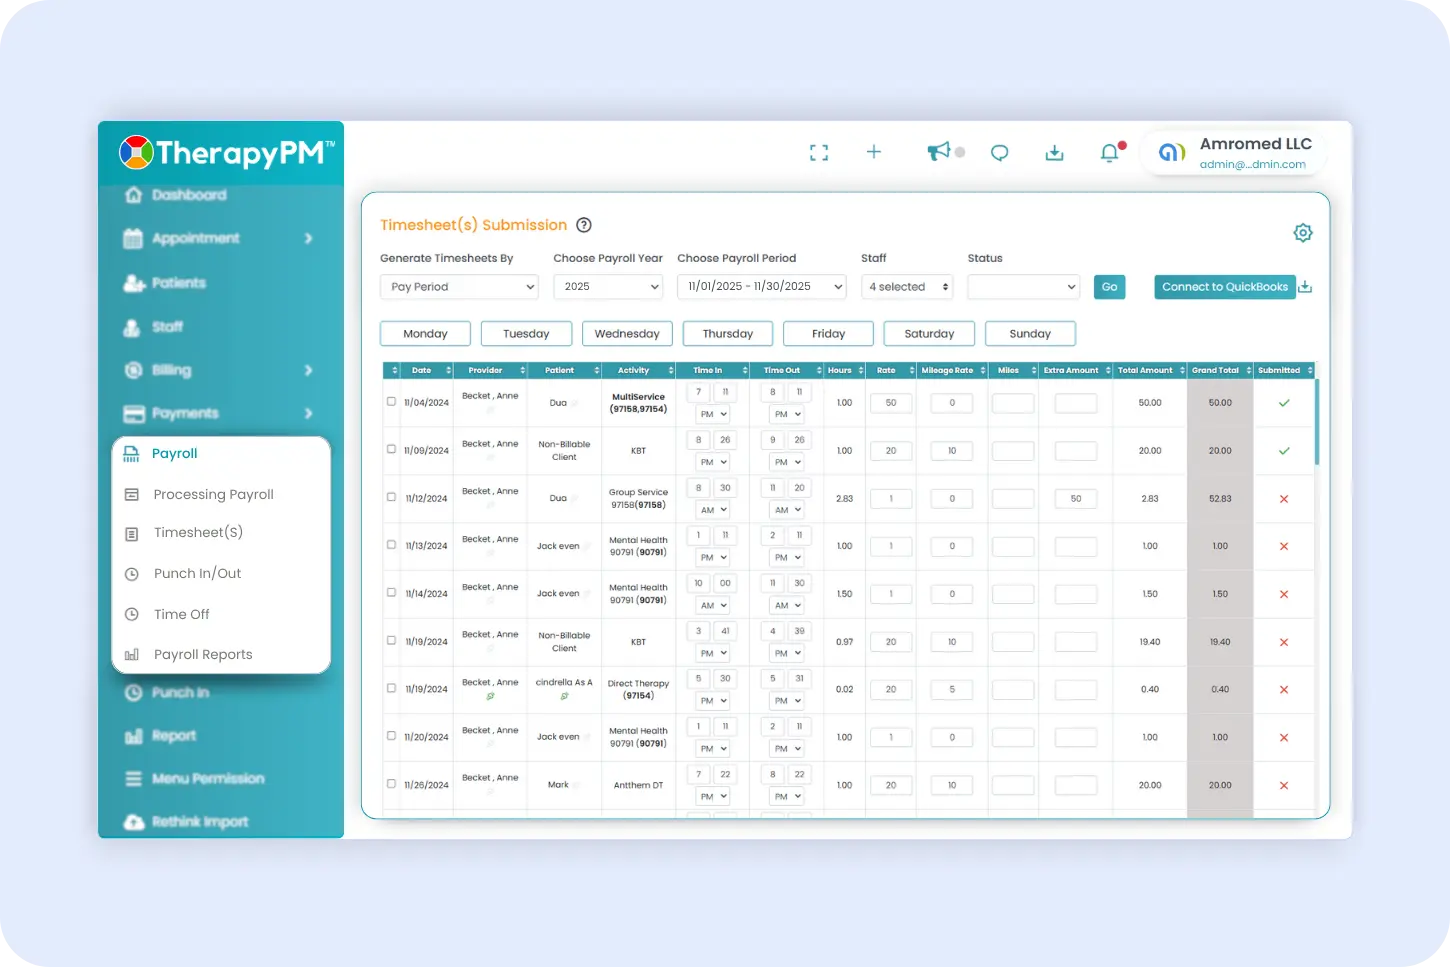
Process Provide Payments Accurately on Time
Process, generate, and submit payroll or timesheets. Calculate punch in/out, manage time off, and view payroll reports by service or rate.
Learn more 🡺
Make Client Communication Easier and Safer
Clients can view schedules, intake forms, personal info, and invoices. Pay easily, share treatment plans, and learn the software with in-app tutorials.
Learn more 🡺
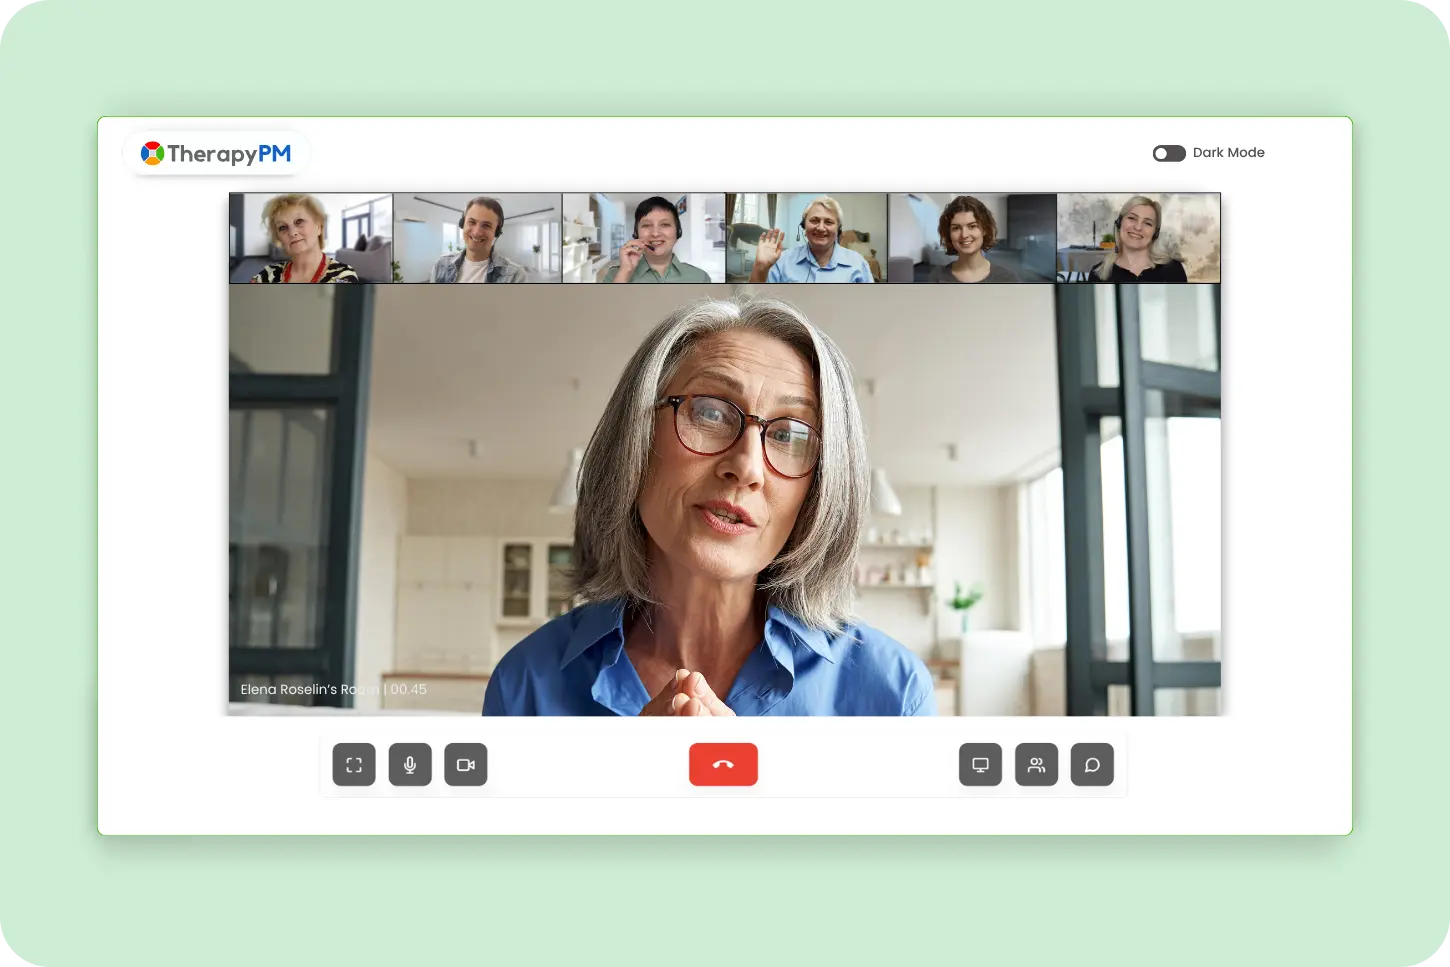
Intuitive Telehealth Sessions - Anywhere & Anytime
Start video sessions securely in one click.
Manage video & audio, share screens, distribute meeting links, and chat in real time.
Learn more 🡺